Tracking labs and common mistakes
The three labs below build the set in that order: load the terms Google recorded, prune what you already track down to rows that earn their slot, then fix an interval and write down why.
Labs
Lab 8.1 — Load the terms Google says people actually used
Lab · Where: Overview (
/b/{businessId}/overview) · Cost: paid · Time: ~10 minYou need: Lab 0.3 (a practice business) and Lab 0.4 (a connected Google Business Profile). This lab needs owner access — the search-terms card only exists for a profile you control.
- Open Overview and scroll to the Performance panel.
- Press Load performance data. One paid click buys the full daily history; switching periods afterwards is free, since it slices data you own. That single load also covers the outcome tiles above the chart — views, calls, direction requests — which are read properly in Did it work?. Ignore them for now.
- Below the chart, find What people searched to find you. Its subtitle reads trailing 12 months — one number per term for the whole year, which is what Google returns.
- Copy the top ten terms into a table and mark which were on the set you built in Lab 6.2.
- Mark every value displayed as
<a number. Those are the terms Google withheld; the true count is below what is shown. - Press Load trend to buy the month-by-month construction. The subtitle changes to month by month, last 12 months and the card grows Trend and Last month columns.
What good looks like. Several of the top ten are terms you would never have written, longer and more specific than your own phrasing. Your business name sits near the top — for most established businesses it is the largest single term, and it is not a discovery win.
If it went wrong. No card means no live Google connection, or one not yet linked to a location (the panel shows a link-location card instead). "No keyword data yet — Google reports monthly" means a new or low-traffic profile, not a failure.
Observe-only readers. Without owner access this report does not exist for you, in any tool. The substitute is the paid suggestion list on Rankings plus autocomplete typed by hand — but be clear about the loss: suggestions tell you what people search in your category, never what they searched to find this business. The same terms sit in the Business Profile dashboard's performance section; see doing it without SEOG.
What you just learned. There is a source that is not a guess, and it is a survivor's list: it corrects your vocabulary and cannot show your gaps. And a "monthly" report is not automatically a monthly series — where no month is attached to a number, a trend line is either constructed deliberately or invented accidentally.
Lab 8.2 — Prune and span
Lab · Where: Rankings (
/b/{businessId}/rankings) · Cost: free to remove, paid to add · Time: ~20 minYou need: Lab 6.2 (a first tracked set). Lab 8.1 improves it, but is not required.
- On paper, list every row you track, with its position and its intent tag from chapter 6.
- Put each through the three questions above.
- Remove what fails. Select the keyword, use the delete control on its detail panel, confirm Stop tracking. Read the dialog first: removing a keyword deletes its rank history, and that cannot be undone. Screenshot the position chart of anything you may want later.
- Add the terms worth tracking from Lab 8.1 with Track. Each add runs a first live check, so this part is paid.
- Before and after, write down the four figures on the Local visibility card.
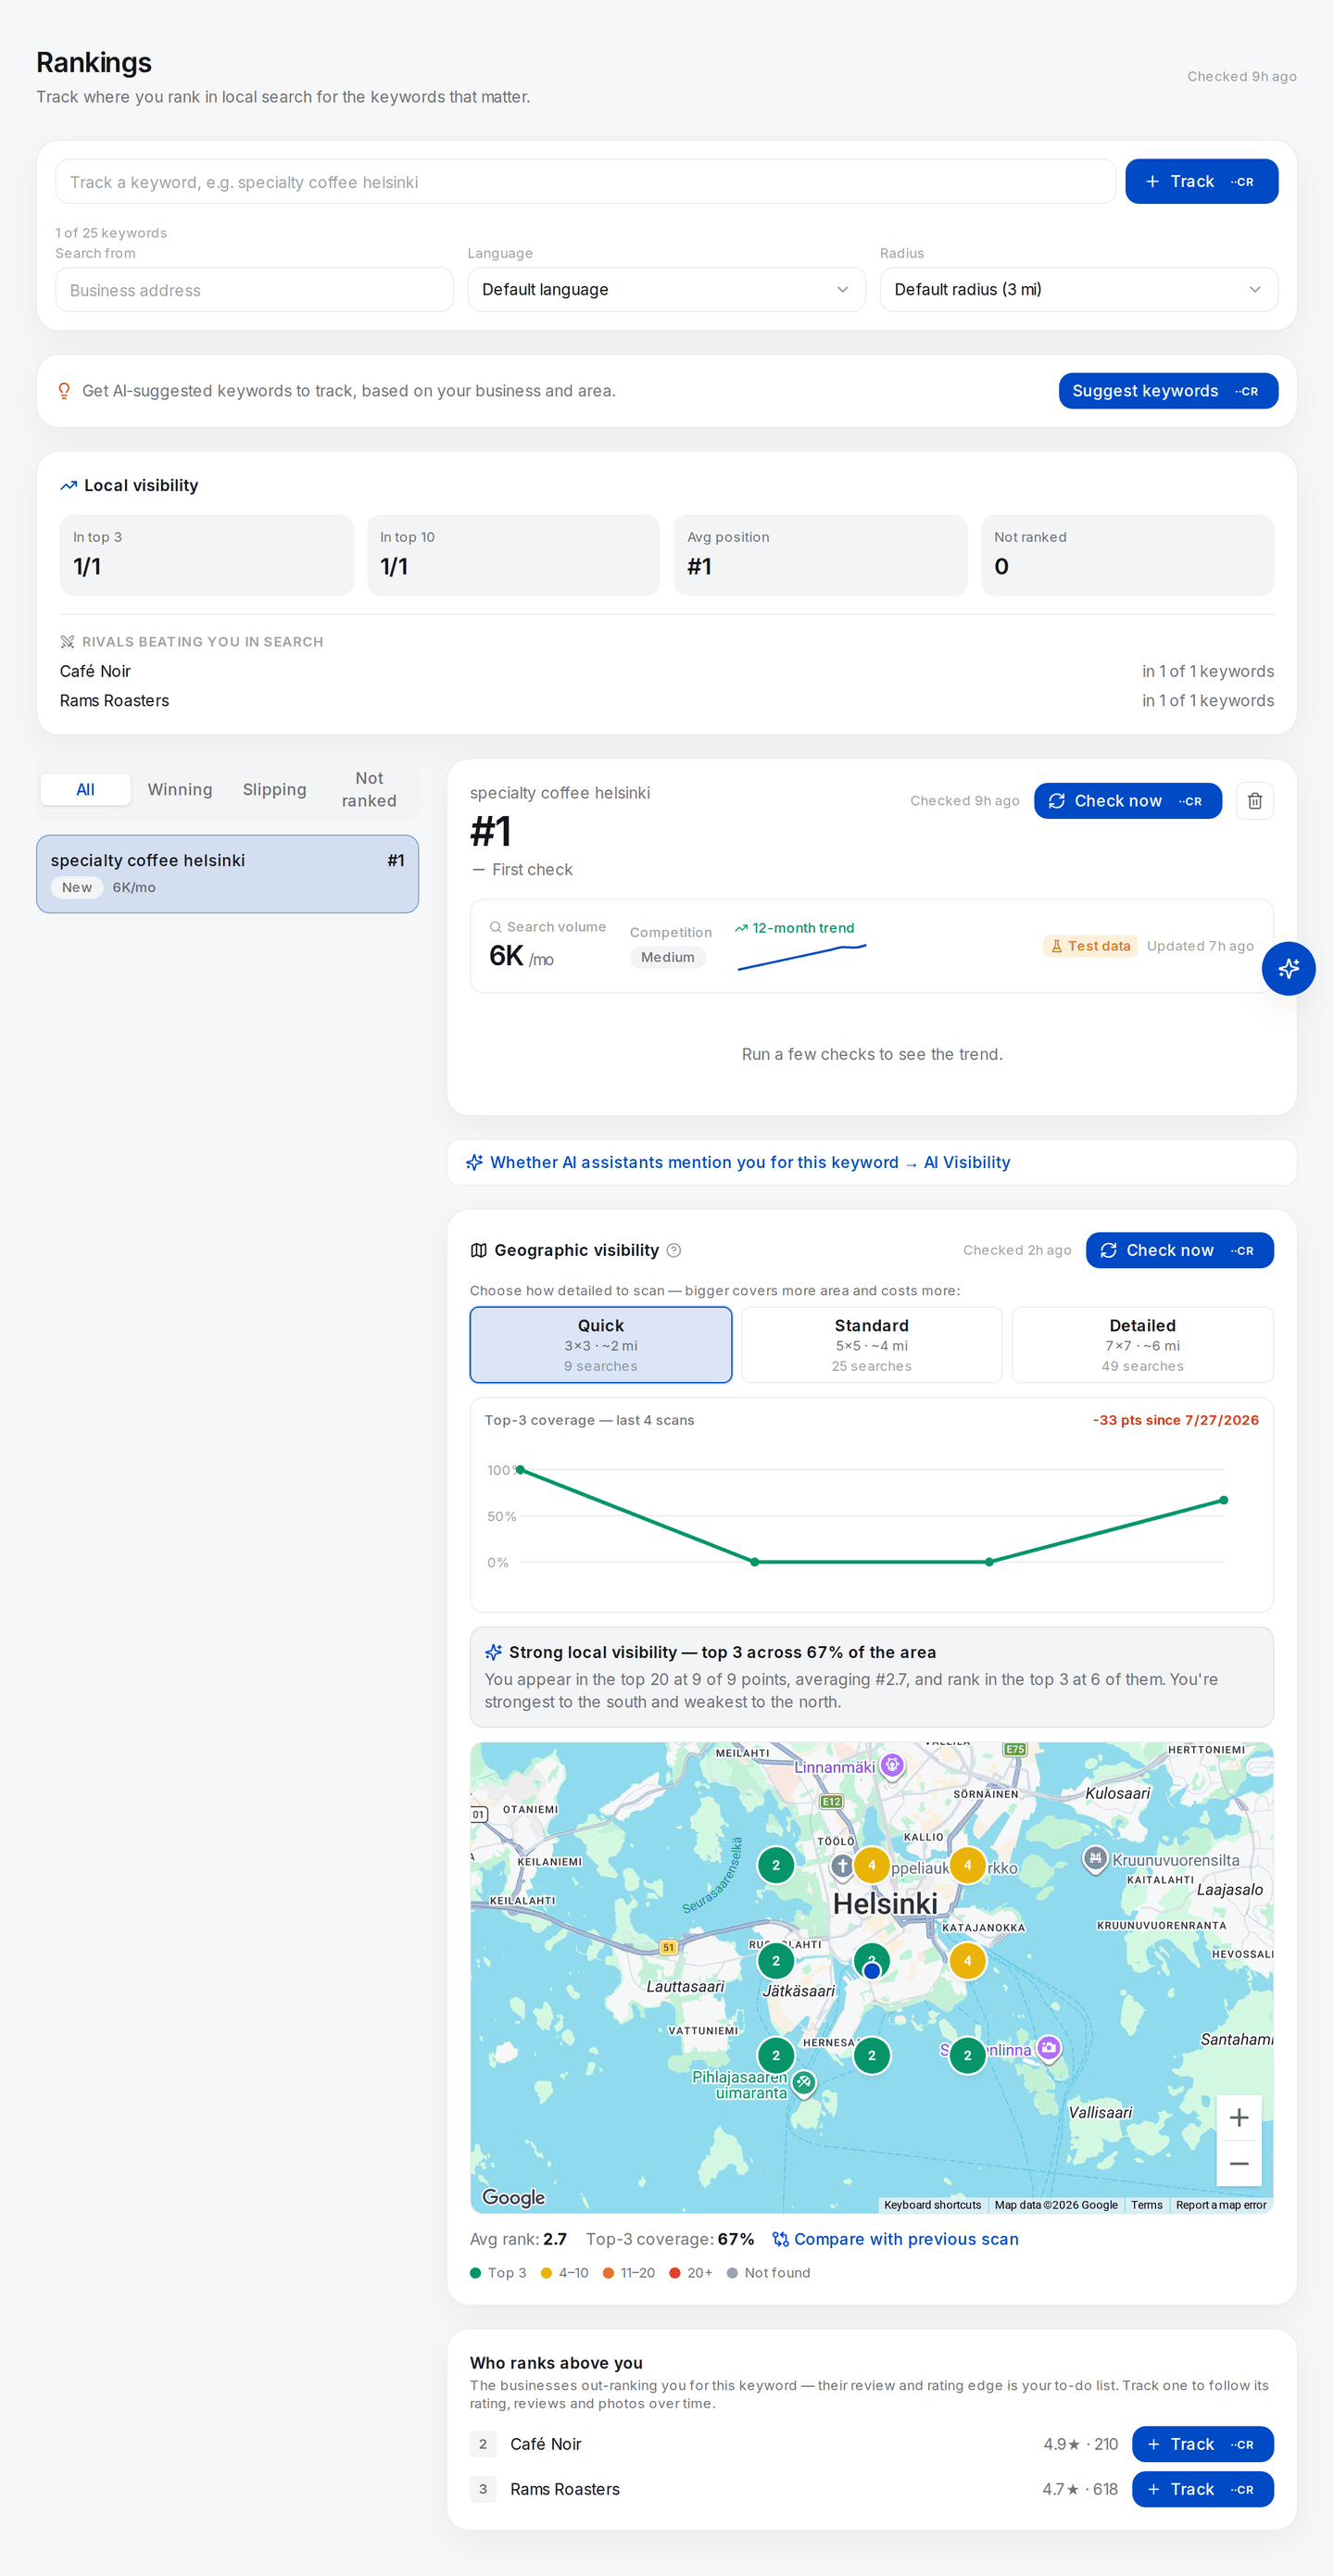
The detail panel from step 3 — the delete control is the small bin beside Check now, and Who ranks above you answers the third pruning question for you. Read the rest sceptically: the position and its "Checked 2h ago" stamp came from a live check, but the search-volume row carries a Test data badge (no volume provider was configured on this instance) and the map is the card's labelled example scan, shown until you run a real one.
What good looks like. Fewer rows than you started with, every survivor naming a distinct question or place — and your headline numbers worse while the set got more honest. That contrast is the lesson.
If it went wrong. If the tracker refuses a new keyword you are at your plan's allowance; the counter under the input shows the slots used. Remove a near-duplicate rather than upgrading — that is the exercise. Re-adding a row you removed starts a fresh history from today.
What you just learned. Portfolio metrics are properties of the sample, not the business. Anyone can improve them without touching Google, which is why a report should state what is in the set and what changed since last month.
Lab 8.3 — Set the cadence and justify it in writing
Lab · Where: Overview (
/b/{businessId}/overview) · Cost: paid · Time: ~10 minYou need: Lab 8.2.
- On Overview, find Rankings at a glance and press Refresh rankings. This rank-checks every tracked keyword in one action, so the whole set carries one timestamp.
- Write today's date at the top of a note, and the next scan date under it.
- Under that, write one sentence per lever you are waiting on: what you changed, what you expect it to move, and when it could plausibly show. If you cannot name what you are waiting for, you have picked a habit rather than an interval.
- Put the next date in a calendar. Between now and then, read your stored data freely — it costs nothing.
- Return to Rankings a week or more after the last check and the page shows an ageing banner with the data's age in days. That is information, not an instruction — dismiss it and nothing breaks.
What good looks like. One dated, uniform refresh across the set, plus a written interval with a reason. "Monthly, because the only lever in flight is review acquisition and that takes months" is a good one.
If it went wrong. If your justification turned out to be "weekly, because the client report is weekly", you have found a real conflict rather than made a mistake. Report weekly if you must; measure on the cadence the signal deserves, and never present a week's wobble as a result.
What you just learned. Cadence comes from how fast the signal moves and how noisy the instrument is, not from the invoicing calendar — and a uniform timestamp is what makes rows comparable at all.
Common mistakes
Tracking the terms you wish you ranked for. Tempting, because the head term feels like the prize. It costs you the month: aspirational head terms return Not ranked on every row for a long time, and a flat line cannot distinguish progress from nothing. The mirror image is a page of branded #1s — impossible to argue with, which is what makes it worthless.
Reading a thresholded value as a count. <40 is not 40. It is "somewhere under 40", and it is the shape of most of your long tail. Sum a column of them and you have an upper bound that everyone will read as a total.
Charting a month-over-month keyword trend from a single pull. The data has no month attached. If nobody made a request per month, the months on that chart were assigned by the tool rather than by Google — and you will be asked to defend them eventually.
Check yourself
1. Your top-ten search-terms report is dominated by terms containing your business name. What does that tell you? That unbranded discovery is thin. Branded impressions are people who already know you looking you up — a finding you would have missed entirely by tracking only the terms you chose yourself.
2. You remove three duplicate rows and your In top 3 figure falls from 6/10 to 3/7. Did your visibility fall? No. Nothing changed on Google; you changed the denominator and the composition of the sample. Portfolio metrics describe a set, not a business — which is why a report should disclose changes to the tracked set.
3. A keyword shows Not ranked three checks in a row. What number goes on the report? None. Write "not found in the top twenty", with the depth stated. Writing 21, or 25, or 100 imputes a value you did not measure, and every average built on it inherits the invention.
4. Your client asks for daily rank tracking. What do you say? That you will report as often as they like, but measure on an interval matched to how fast positions move, because a daily series on a weekly-moving signal mostly measures the instrument. Then offer the alternative: the same spend spread across more places and more intents instead of more days.
Your set now describes the market rather than your hopes about it, with a defensible interval attached. The next chapters change things — profile fields, photos, reviews — each measured against the baseline you froze last chapter, using the set you just built.